
1. Visual workflow editor
A canvas where you connect nodes for services and actions. Every node shows its inputs and outputs, so the data flow is visible.
Cookies on this site
We use statistics cookies to see which pages and tools are useful, and marketing cookies to measure campaigns. You choose. Privacy policy
Open-source automation for construction data
Visual, open-source platforms that build complex workflows without code, much like Dynamo or Grasshopper. With our ready pipelines you can automate CAD/BIM data processing, validation, QTO and cost estimation today.
Why automate
A major challenge in using new technologies is that data, while abundant, remains fragmented, unstructured, and often incompatible between different systems and programs. Tools exist, but data chaos keeps the industry trapped in manual processes. The solution is automation, accessible and understandable for everyone, not just programmers.
Open-source platforms
Choose the right tool for the job. All four are open source and can run on your own machine.
Workflow automation
Visual workflow automation with 400+ integrations. Ideal for file operations, APIs, notifications and data processing.
Official siteAgentic AI platform
Build AI agents and RAG pipelines visually. Supports 100+ LLM models, document processing and autonomous reasoning.
Official siteLLM workflow builder
Drag-and-drop LLM workflows with 100+ integrations. Multi-agent orchestration and Graph RAG.
Official siteVisual AI builder
Python-based visual builder by DataStax. Native LangChain integration, MCP support, rapid prototyping.
Official sitePrefer to describe a task in words instead of drawing it? AI agents for construction
n8n essentials
A canvas where you connect nodes for services and actions. Every node shows its inputs and outputs, so the data flow is visible.
n8n is strong at error management:
For power users:
Critical for sensitive project data:
Quick start
Then take a ready-made pipeline and launch it. For agents in code, start with DDC Skills for AI Agents on GitHub.
From the official site. Takes about two minutes.
In CMD or PowerShell:
npx n8nornpm install n8n -gIn your browser at localhost:5678. Import a workflow JSON and press Execute.
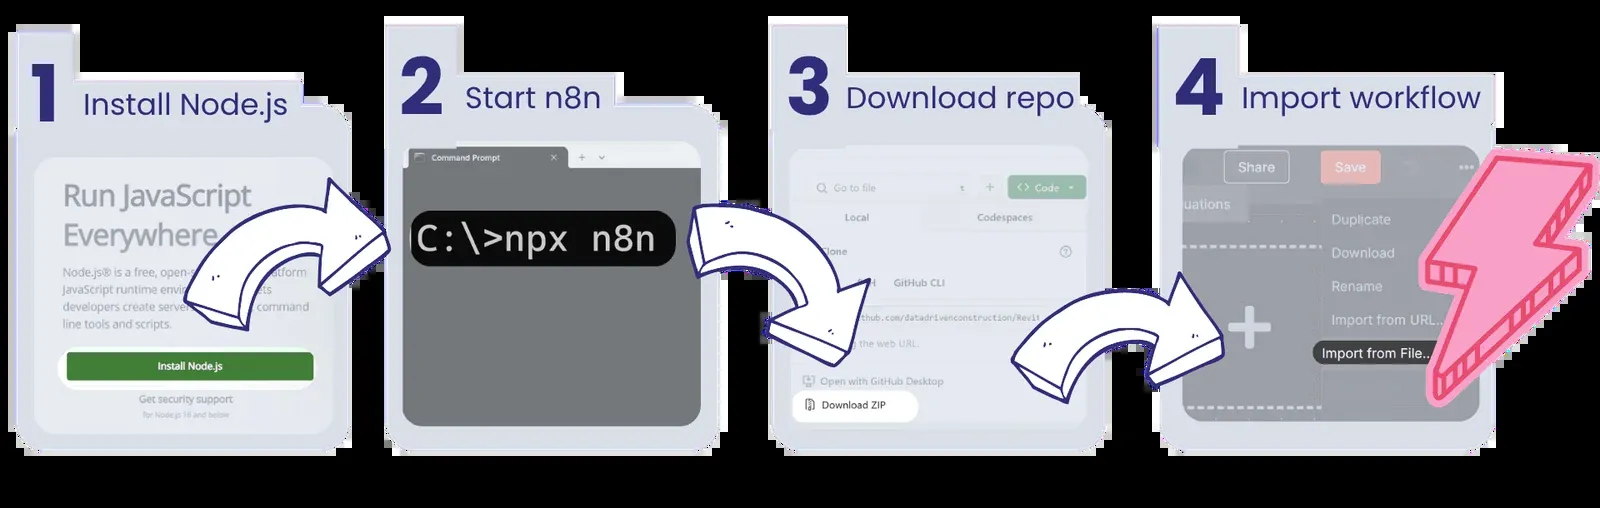
AI integration
Claude, ChatGPT and other models plug straight into n8n: add the node and write the prompt for text generation, data analysis or reports. Modern models can also generate a working n8n pipeline in minutes from a description of the logic.
Create a JSON pipeline for n8n with the following logic: 1. Read files from a folder 2. Extract data from PDFs 3. Save to Excel with formatting 4. Send report via email with attachments
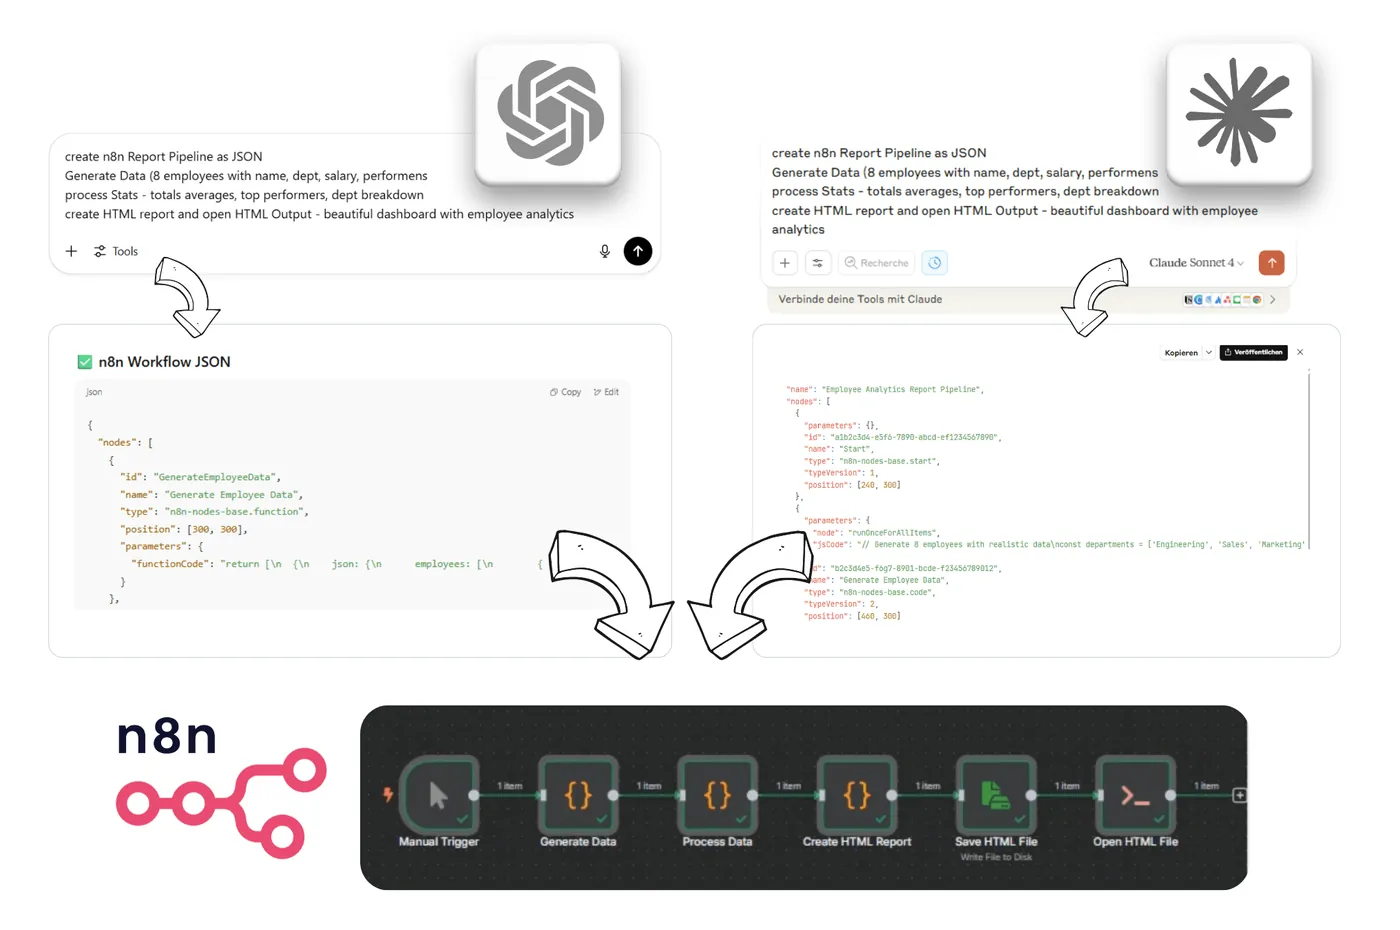
Templates are imported as JSON, adapted and run immediately. Data from CAD, BIM, CAFM, ERP, Excel and cloud services starts speaking the same language, and automation becomes a tool for everyone, from project managers to design engineers.
Practical examples
Every pipeline is free on GitHub and as a template on n8n.io. To use one: import the JSON, set the converter path and the project file path, press Execute.
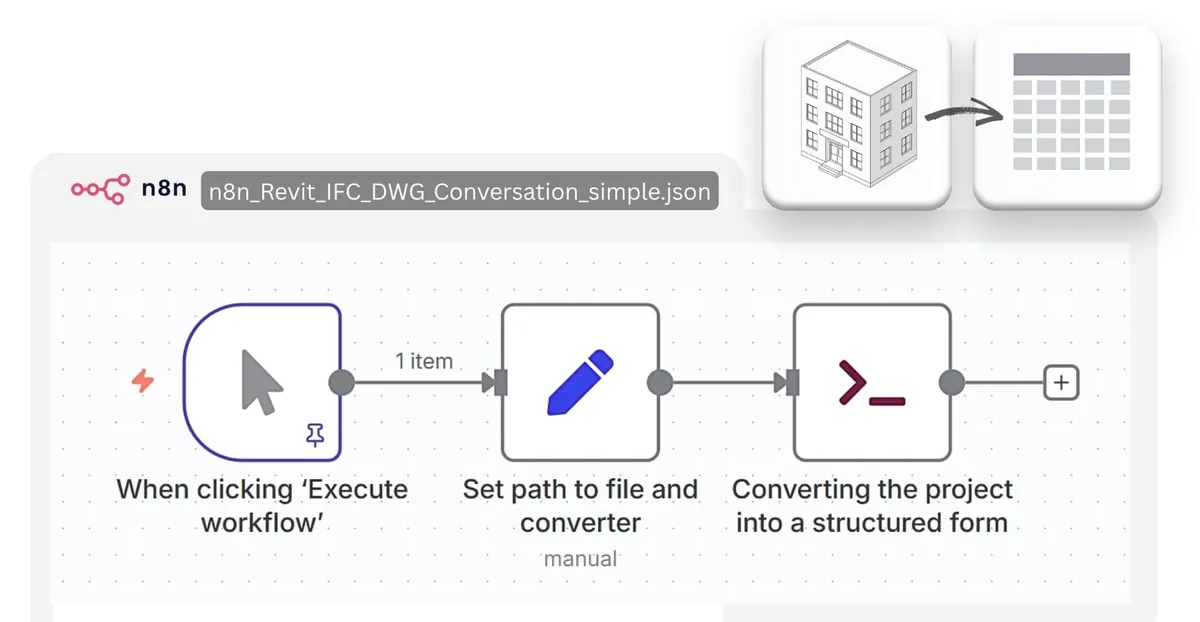
Converts .rvt, .ifc or .dwg files into an element database (.xlsx, .csv) and exports 3D geometry (.dae). Runs locally, without internet or Autodesk licences.
n8n_Revit_IFC_DWG_Conversation_simple.json
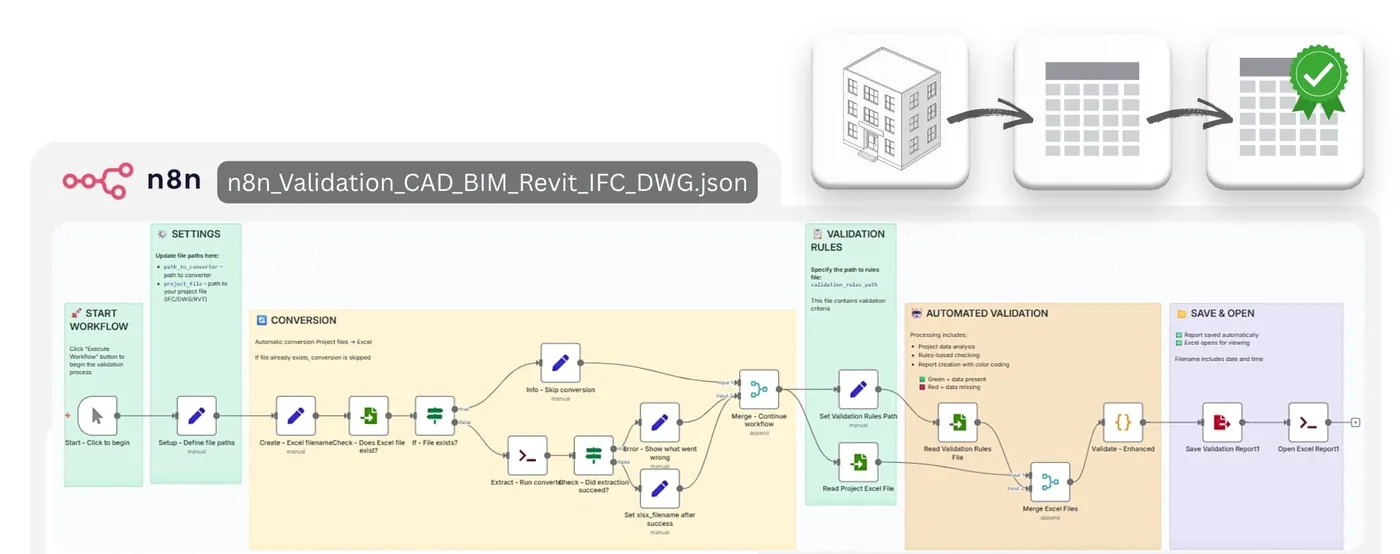
Reads CAD/BIM data and checks for missing or wrong parameters by group, type or any other criterion. The report shows completion percentages and unique parameter values; rules can come from your EIR, BEP or IDS.
n8n_Validation_CAD_BIM_Revit_IFC_DWG.json
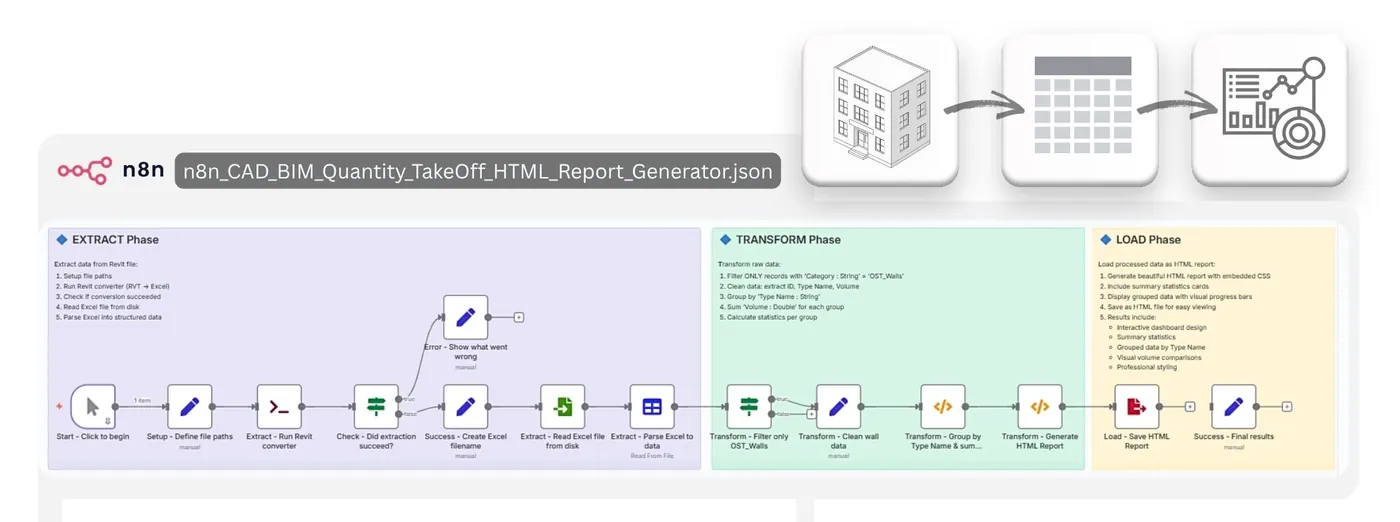
Calculates volumes and other quantities for selected element groups and writes an HTML report. Made for quick grouping, calculations and estimates.
n8n_CAD_BIM_Quantity_TakeOff_HTML_Report_Generator.json
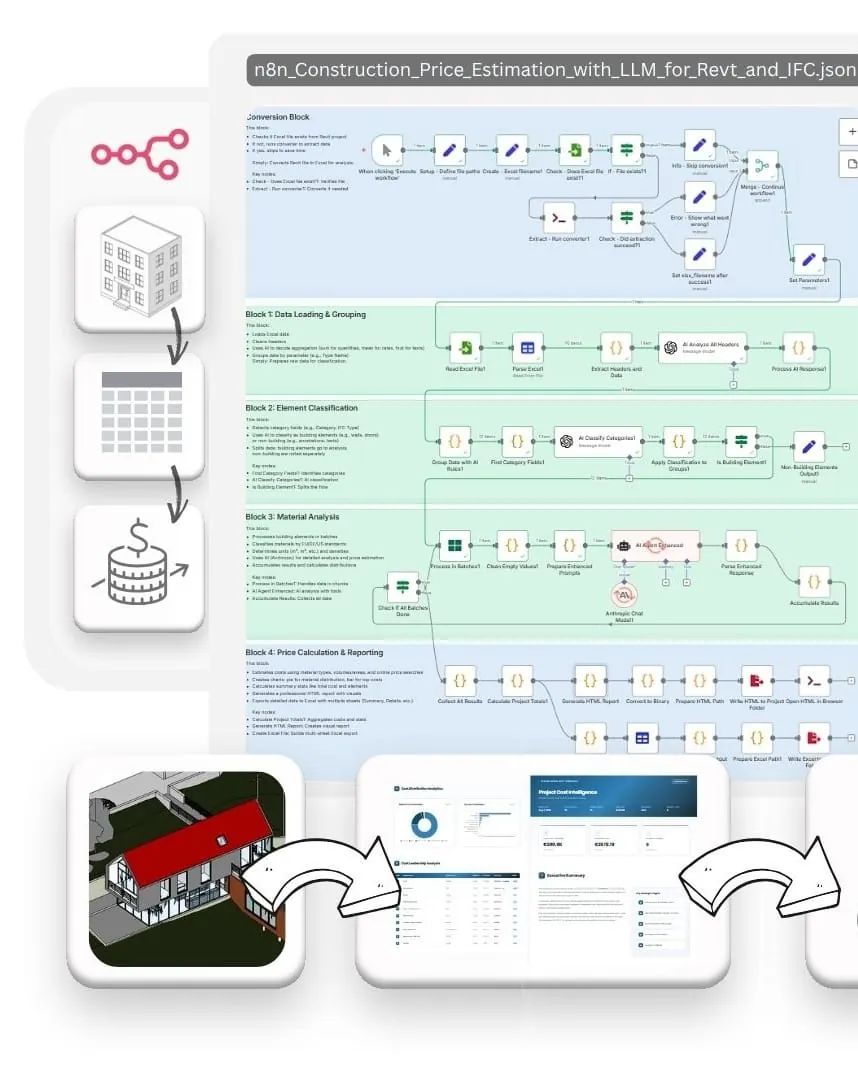
Estimates the cost of building elements from CAD/BIM files. AI classifies the materials, searches prices and builds a cost report.
n8n_5_Construction_Price_Estimation_with_LLM_for_Revt_and_IFC.json
Auto classification and mapping
Pipelines sort building elements from Revit, IFC or DWG into standard categories and map their attributes for further calculations: quantities, cost, carbon footprint.
Element classification with LLM and RAGETL in code
When a company is not ready for a full ERP, automation starts outside it: modular code that turns data into an open structured form, then runs checks, transformations and messages on a schedule. Pandas is the main tool.
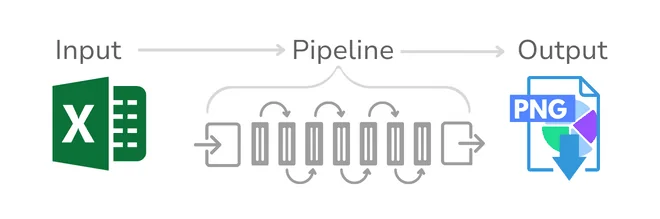
1Extract open the data
import pandas as pd
import matplotlib.pyplot as plt

# Table produced by the converter
DDCoutput_file = file_path[:-4] + "_rvt.xlsx"
df = pd.read_excel(DDCoutput_file)2Transform group and visualise
# Sum 'Amount' by 'Category' and plot it
ax = df.groupby('Category')['Amount'].sum().plot(
    kind='bar', figsize=(10, 5), color='skyblue',
    title='Expenses by Category', ylabel='Amount',
rot=45, grid=True).get_figure()3Load export
# Save the chart as PNG
plt.savefig(r"C:\DDC\expenses_by_category.png")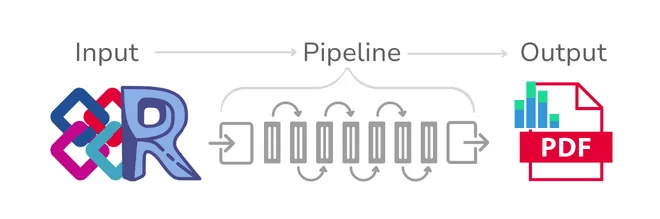
1Extract open the data
import pandas as pd

# Revit or IFC data after conversion
DDCoutput_file = file_path[:-4] + "_rvt.xlsx"
df = pd.read_excel(DDCoutput_file)2Transform group and chart
# Group the project by type, chart it
dftable = df.groupby('Type')['Volume'].sum()
graph = dftable.plot(kind='barh', figsize=(20, 12))
graph.get_figure().savefig(r'C:\DDC\graph_type.png',
bbox_inches='tight')3Load PDF report
from fpdf import FPDF  # pip install fpdf

pdf = FPDF()
pdf.add_page()
pdf.set_font('Arial', 'B', 16)
pdf.cell(190, 8, 'Grouping of the entire project by Type parameter', 2, 1, 'C')
pdf.image(r'C:\DDC\graph_type.png', w=180)
pdf.output('Report_DataDrivenConstruction.pdf', 'F')The same idea as a video: tables and charts from a Revit project in one click. Step-by-step guides: install Jupyter Notebook and visualise data from Excel.
From people who automate
A few years ago Data-Driven Construction team showed me Jupyter Notebooks and I fell in love. Since then I do simple data manipulations quicker with a few lines of code instead of manually clicking in Excel. As always it was a gradual process, first I automated repeating tasks. As my confidence and know-how grows, I do more and more. Moreover, with the advent of Chat GPT, it became even easier, by describing the desired outcome I get the code snippets and just need to adapt them. It's saves me a lot of time. E.g. I have a list of new sign-ups and I have my company CRM. Once a month I check if all the signups are in the CRM. Before this was a manual comparison of two different lists. Now it's a press of a button and I get the list with the new signups in the right format to import it back to the CRM. By investing 1h of programming I'm saving 12h of work per year. I reduce failures dramatically. Because I did not like to compare two lists I did not do it as regularly as I should have done it. Moreover, I'm not good at comparing data, every phone call disrupted my work and I forgot to change a data entry. The consequences were that not everybody who should have gotten my newsletter got it. I feel like a god when I program. The more complex work becomes the less direct control over the results I have. But when programming I'm in absolute control of the result. I write a few lines of code and the computer executes them exactly as I tell him. When the result is not as I expected it to be, it's usually because of a logical shortcut on my side, the computer does exactly what I tell him.
 Simon DilhasCEO & Co-Founder · Abstract AG
With the help of Python and especially the pandas library, as the DataDrivenConstruction team does, we are now able to perform delivery checks four times faster. By turning IFC data into a pandas DataFrame and comparing it with quantification tables or classification databases, we have made our expertise fast and reliable.
 Dmitri GarbuzenkoAIM Coordinator · RB Rail AS
The decision to use Jupyter Notebook for results verification turned out to be highly beneficial. Our experience with solutions from Data Driven Construction and Jupyter Notebook has been extremely positive. Overall, the integration of solutions from Data Driven Construction and Jupyter Notebook has greatly improved our workflows. Their combined capabilities and performance have not only optimized data processing, but also produced meaningful results, making them highly recommended tools.
 Irina FischerBIM Coordinator · OBERMEYER Group
Be part of the movement with DataDrivenConstruction! Let’s make true freedom in data formats a reality and catalyze a new era of productivity and innovation in construction. The real and necessary journey from closed to “open” formats has not even started: True freedom in data formats—free from proprietary ties and accessible to all—is what we need to unlock innovation and collaboration across the construction industry, particularly benefiting the 99% of construction, i.e. SMEs and unchaining the sector for accelerated growth
 Prof. Dr.-Ing. Michael BühlerCo-Owner · GemeinWerk Ventures
Local automation
No internet, cloud services or CAD/BIM licences required. Output is structured (SQL, Excel, HTML, JSON), so further analytics and automation are simple.
Statistics and trends
workflows in n8n's public marketplace in 2024.
n8n.io/workflowsmonths for n8n's user base to double, according to the company.
Highland EuropeConstruction remains one of the least digitised industries in the global economy, according to McKinsey Global Institute.
Time to act
A new generation of tools makes integration and AI projects accessible to companies of any size, without a major investment in IT infrastructure. DataDrivenConstruction is an international team and community working on open construction data since 2021: we pick the first process, build the pipeline on your files and train your team.
Let’s talk
Tell us what slows your team down. You get an honest answer on what can be automated, how long it takes and how we would scope it. You pay only after the result.
Greater Karlsruhe area, Germany · on-site in DACH, remote worldwide · EN / DE